Advanced logging
Browses the structured application logs and UDP alerting events KPImailer stores in its own database, for troubleshooting without needing server file access.
-
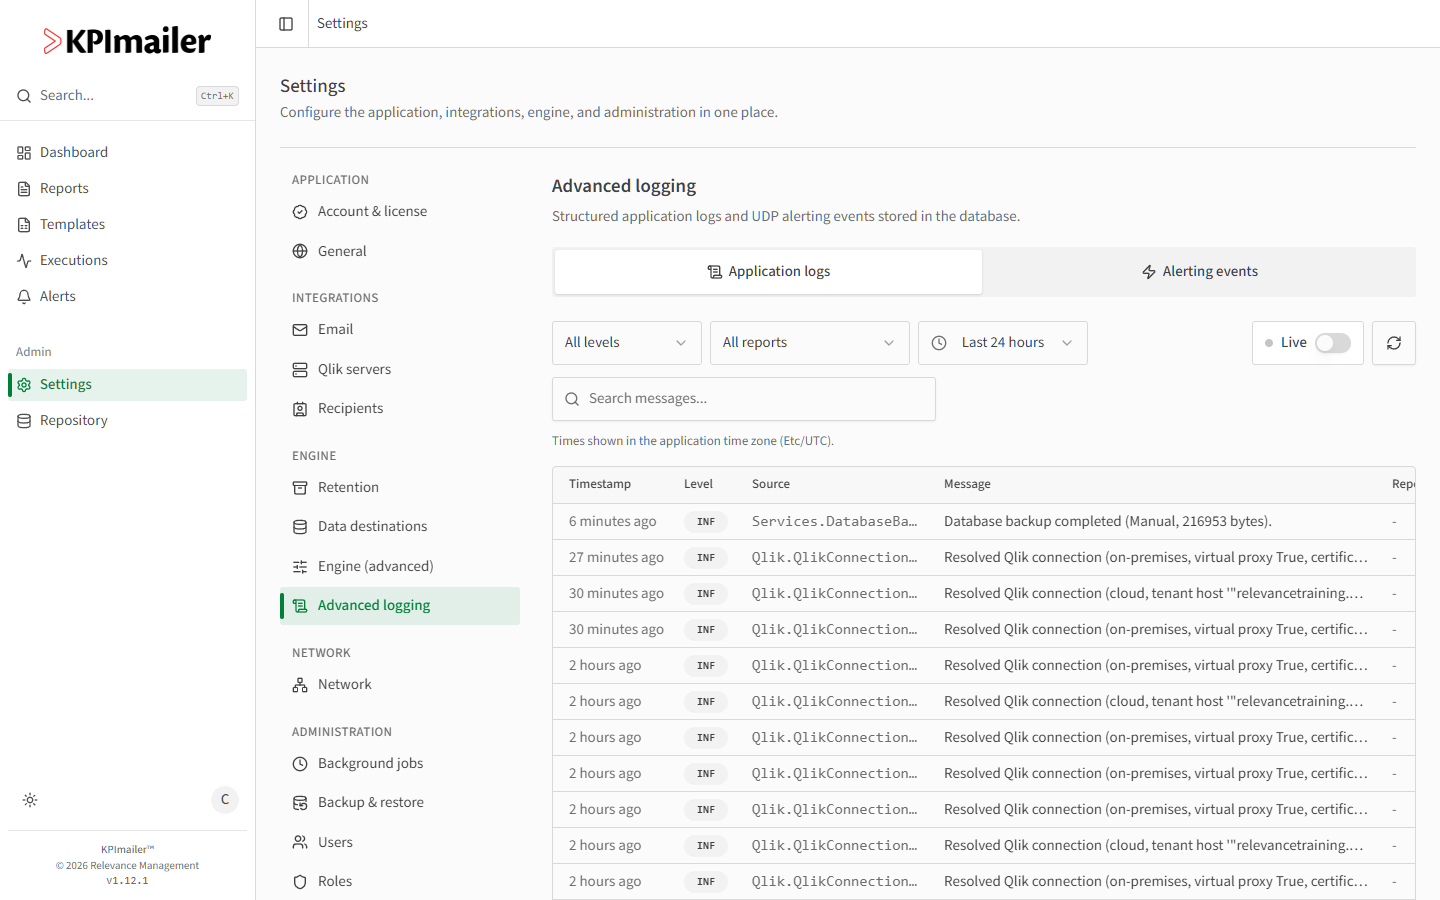
Open Settings → Advanced logging. The Application logs tab is selected by default.
-
Filter by Level (e.g. all levels, or just warnings and errors), Time range (default last 24 hours), or search by Search messages. Each row shows when it happened, its Level, the Source (the internal component that logged it), the Message, and which Report it relates to, if any.
-
Turn on Live to auto-refresh the newest entries every few seconds (first page only) - useful while reproducing an issue.
-
Switch to the Alerting events tab for a parallel log of UDP alerting signals received from Qlik, filterable by Status and whether an Alert fired as a result. See the UDP alerting listener for how those signals arrive.
Both tabs show times in the application’s configured time zone, and both respect the windows set on the retention policy page.
Worked example
Section titled “Worked example”A report intermittently fails against the on-premise Qlik server. An administrator opens
Advanced logging, sets Time range to cover the failure window, and searches for the
report’s name - the log shows a Qlik.QlikConnectionResolver entry just before the failure,
pointing at a connection issue rather than a problem with the report itself.