Walkthrough: build and schedule a report
This walkthrough builds one report from scratch, “Monthly sales summary”, and takes it all the way through design, data scope, attachments, delivery, and scheduling. Each step links to the full page on that topic if you want more detail.
1. Create the report
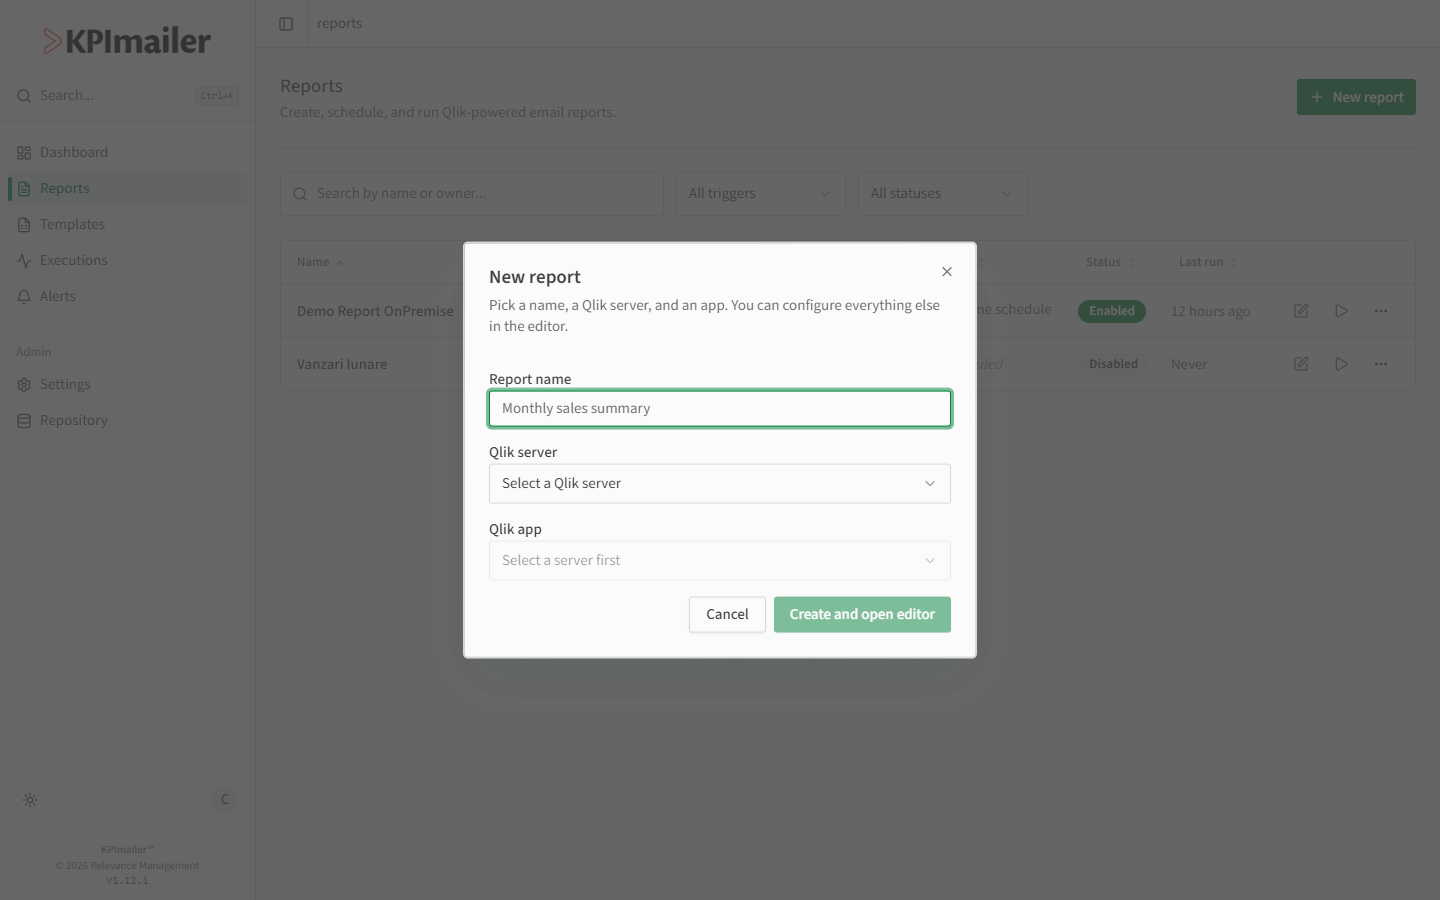
Section titled “1. Create the report”From Reports, select New report, name it “Monthly sales summary”, and pick the Qlik server and app that hold the sales data. Select Create and open editor.
2. Design the layout
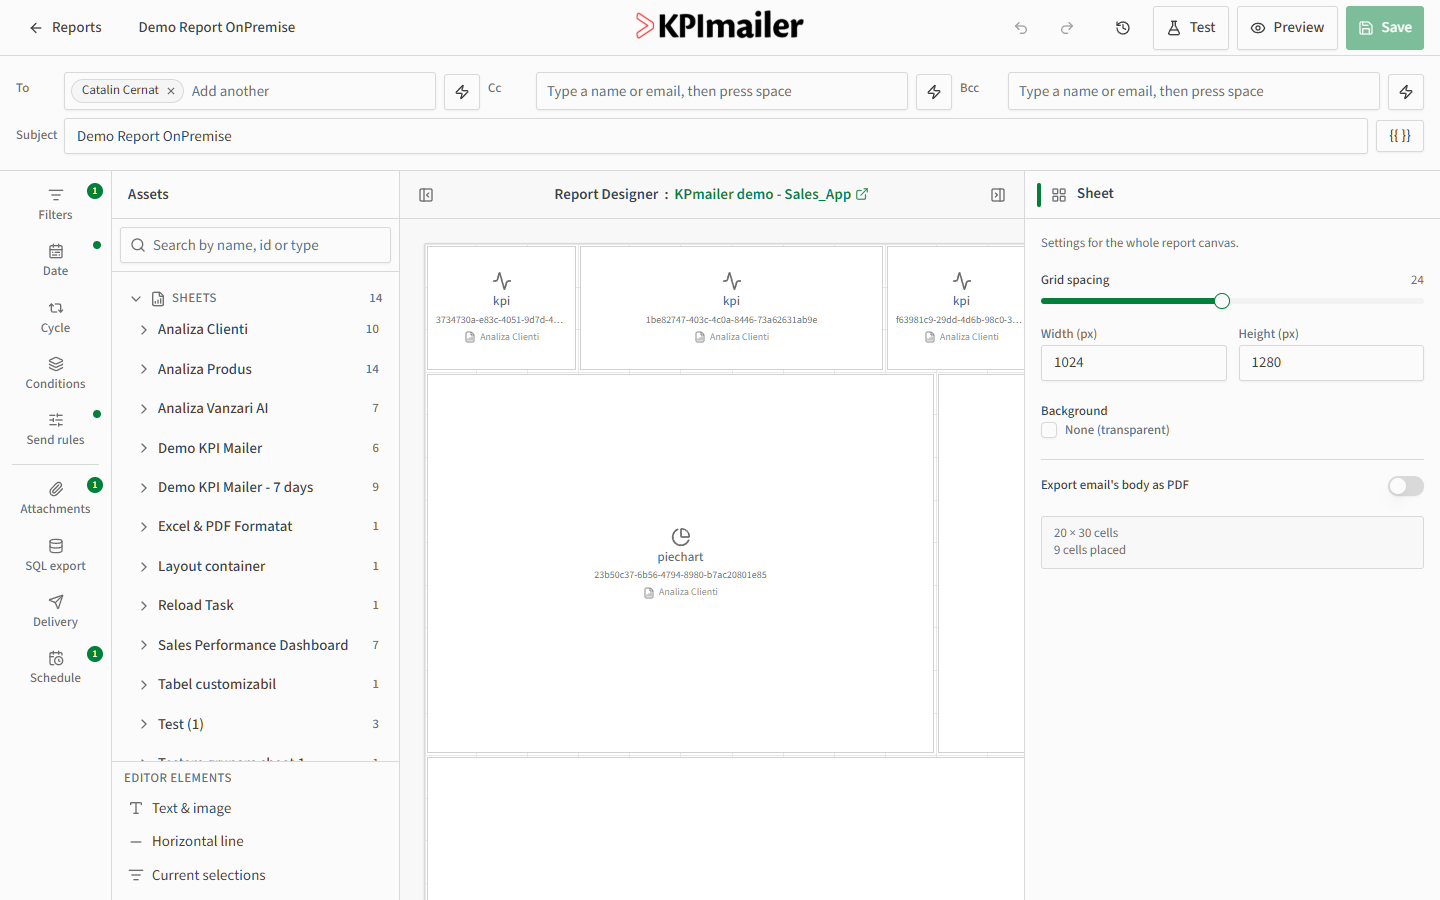
Section titled “2. Design the layout”In the empty editor, drag three KPI objects onto the canvas for headline numbers, then a pie chart and a bar chart below them for the category and product breakdowns. Click the pie chart and bump its Render quality to Retina so it looks sharp in email.
3. Scope the data
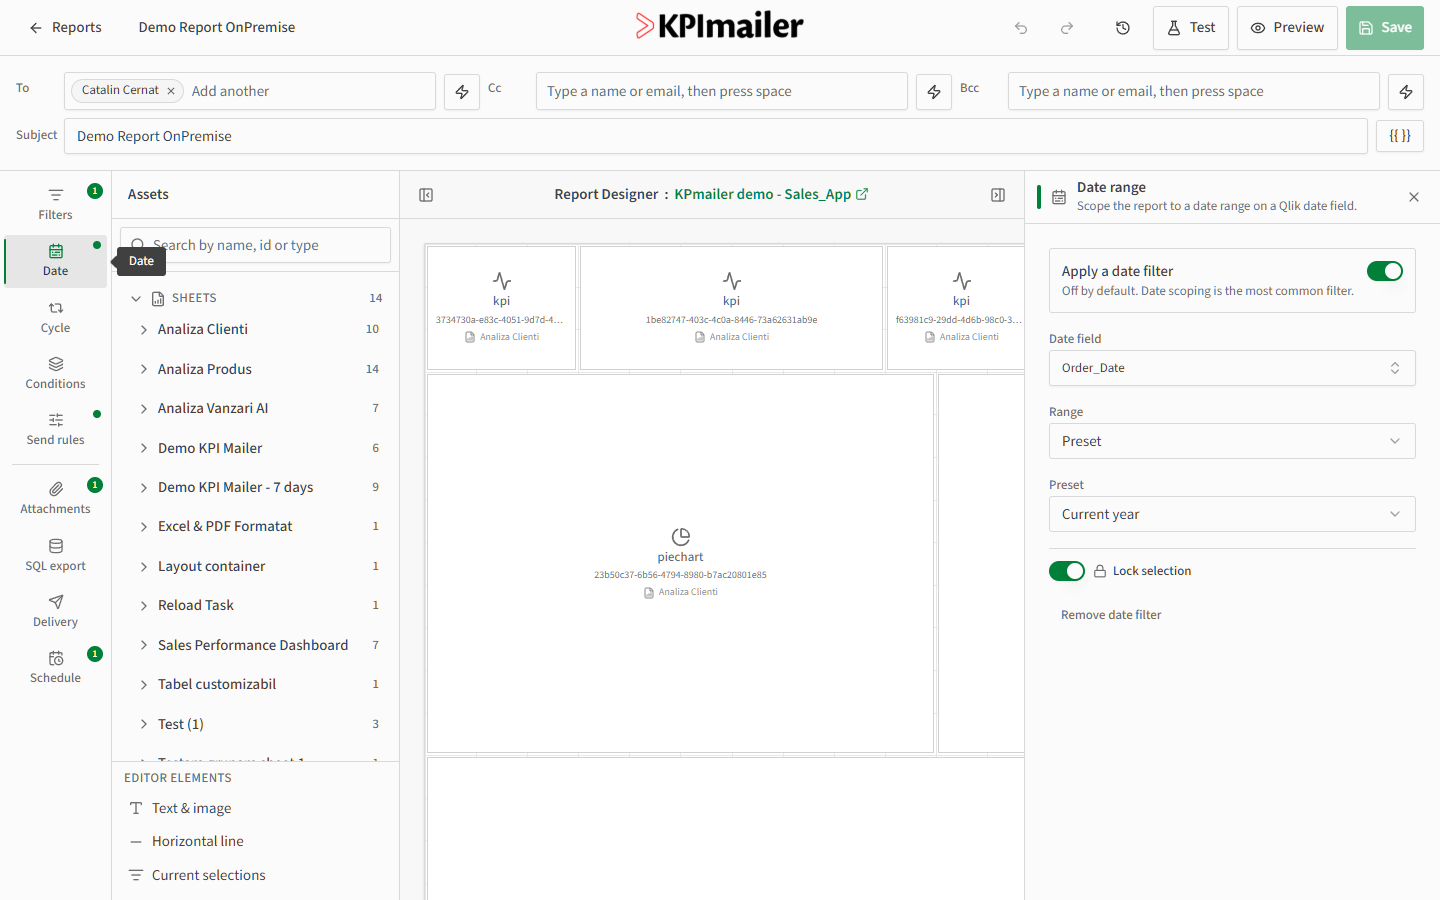
Section titled “3. Scope the data”Open Data and set a Date range of Current month so the report always reflects the latest month without manual updates each time.
→ Data
4. Add an Excel attachment
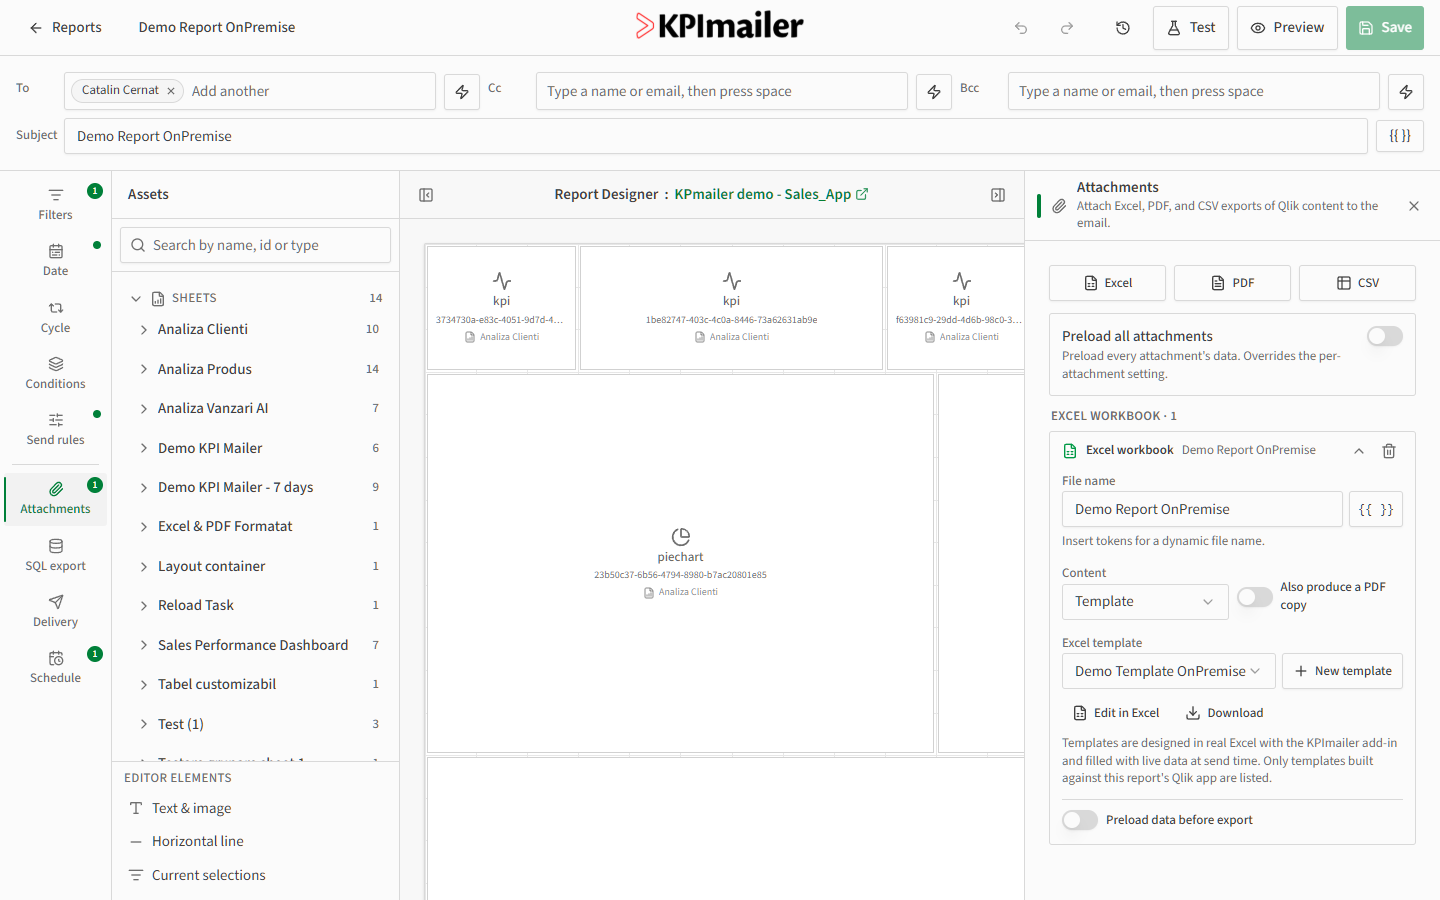
Section titled “4. Add an Excel attachment”Open Attachments, add an Excel workbook, and point it at the team’s existing sales template so finance gets a familiar, formatted file alongside the email.
5. Confirm delivery
Section titled “5. Confirm delivery”Open Delivery and confirm Send by email is on, using the organization’s configured mail profile. Leave Save to a folder and Debug mode off for this report.
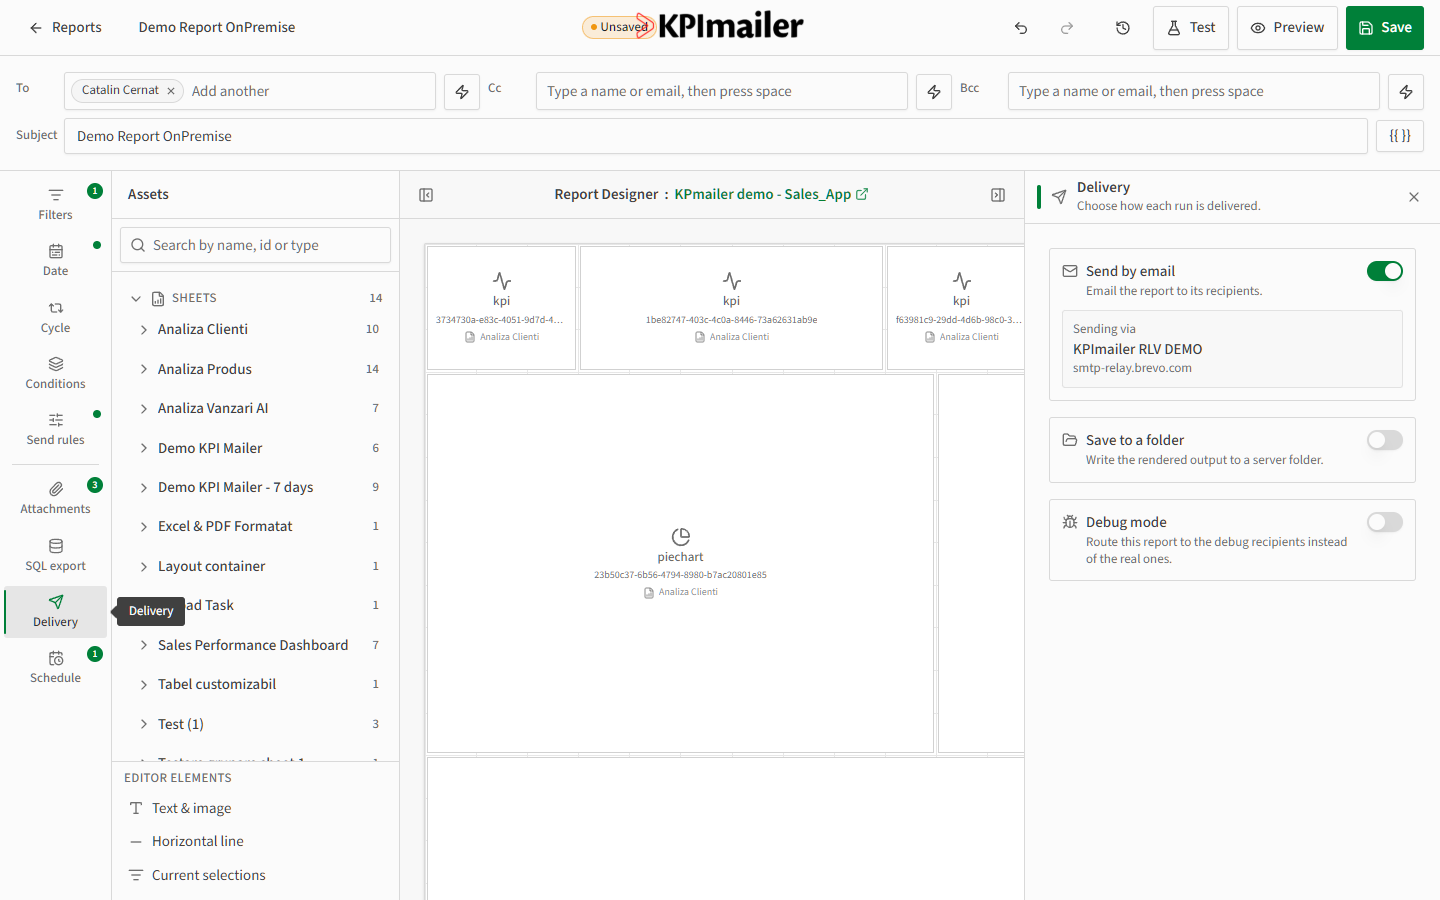
→ Delivery
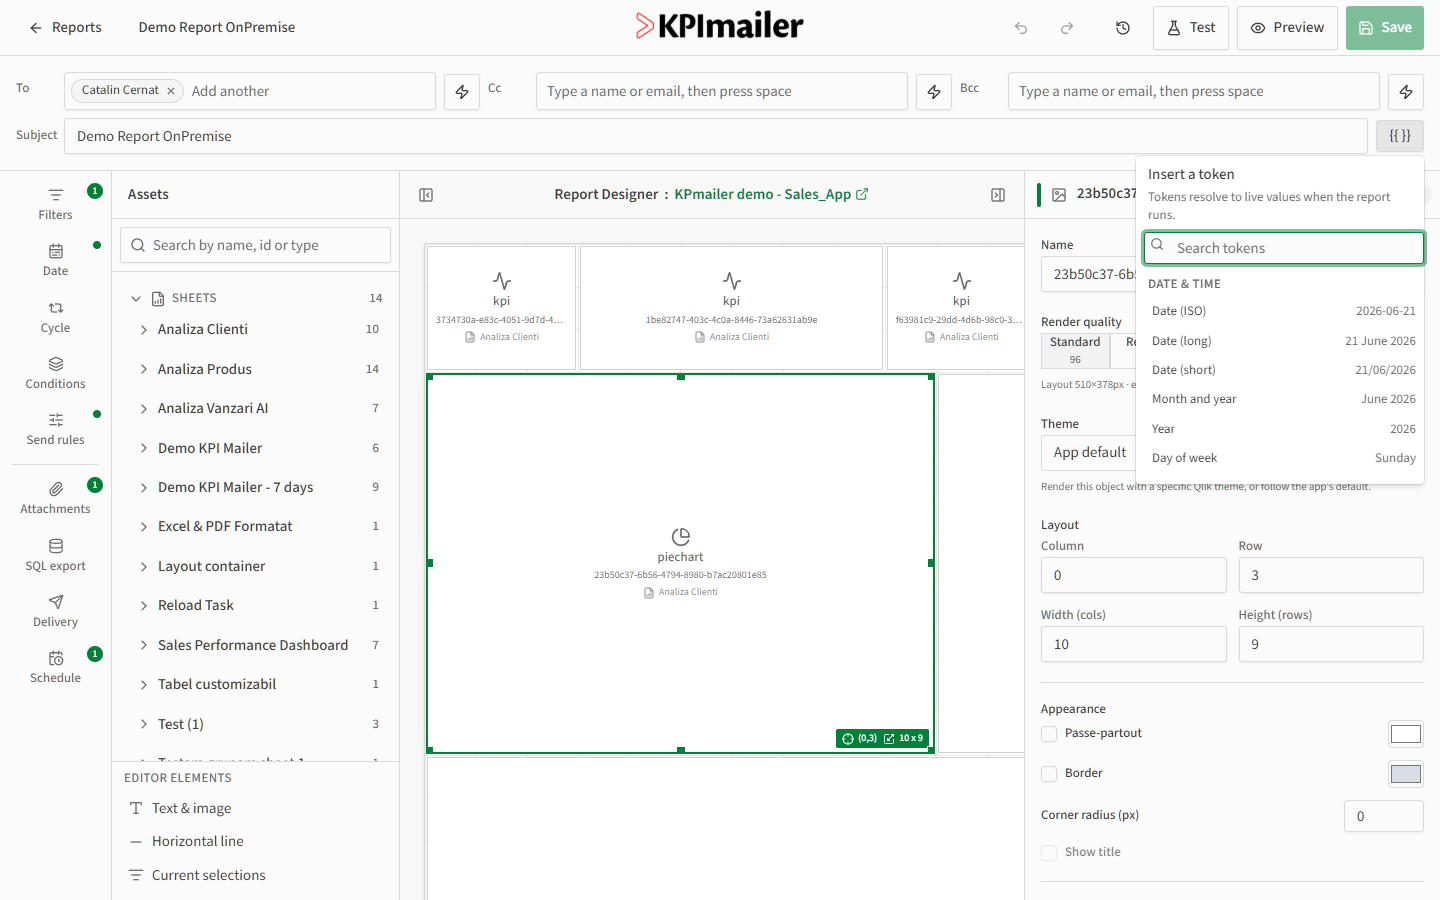
6. Write the subject line
Section titled “6. Write the subject line”Click into Subject and write {{Report name}} - {{Month and year}}, inserting each
token from the {{ }} menu so the subject always shows the right month without editing it
by hand.
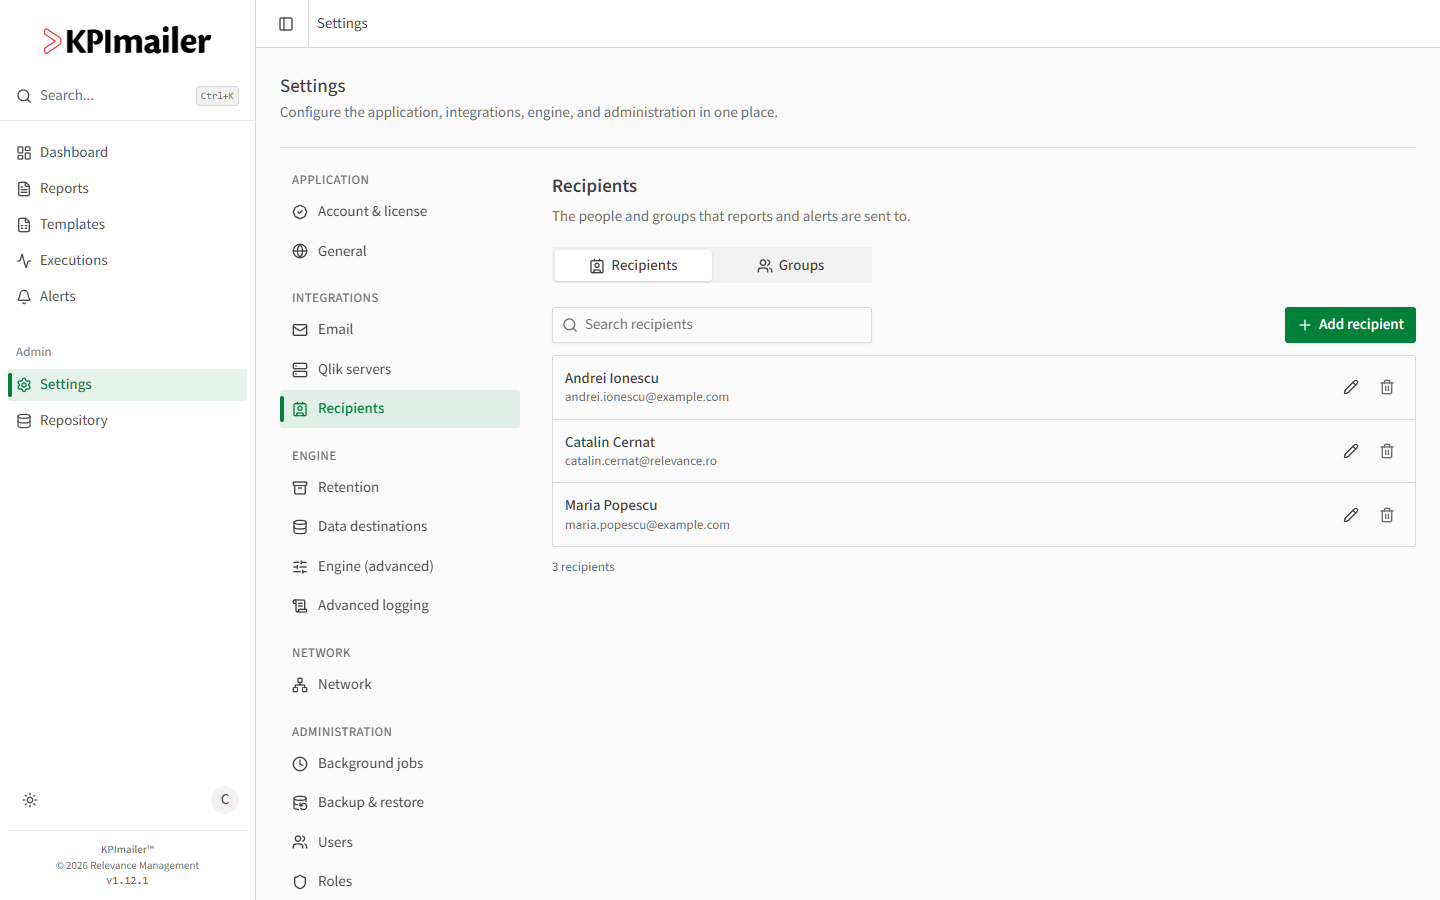
7. Add recipients
Section titled “7. Add recipients”In To, add the sales leadership team directly, then add the Sales Team Romania group so the whole regional team is included without listing each person.
8. Preview, then test
Section titled “8. Preview, then test”Select Preview to render the report exactly as it would send, live against current data, with nothing actually sent.
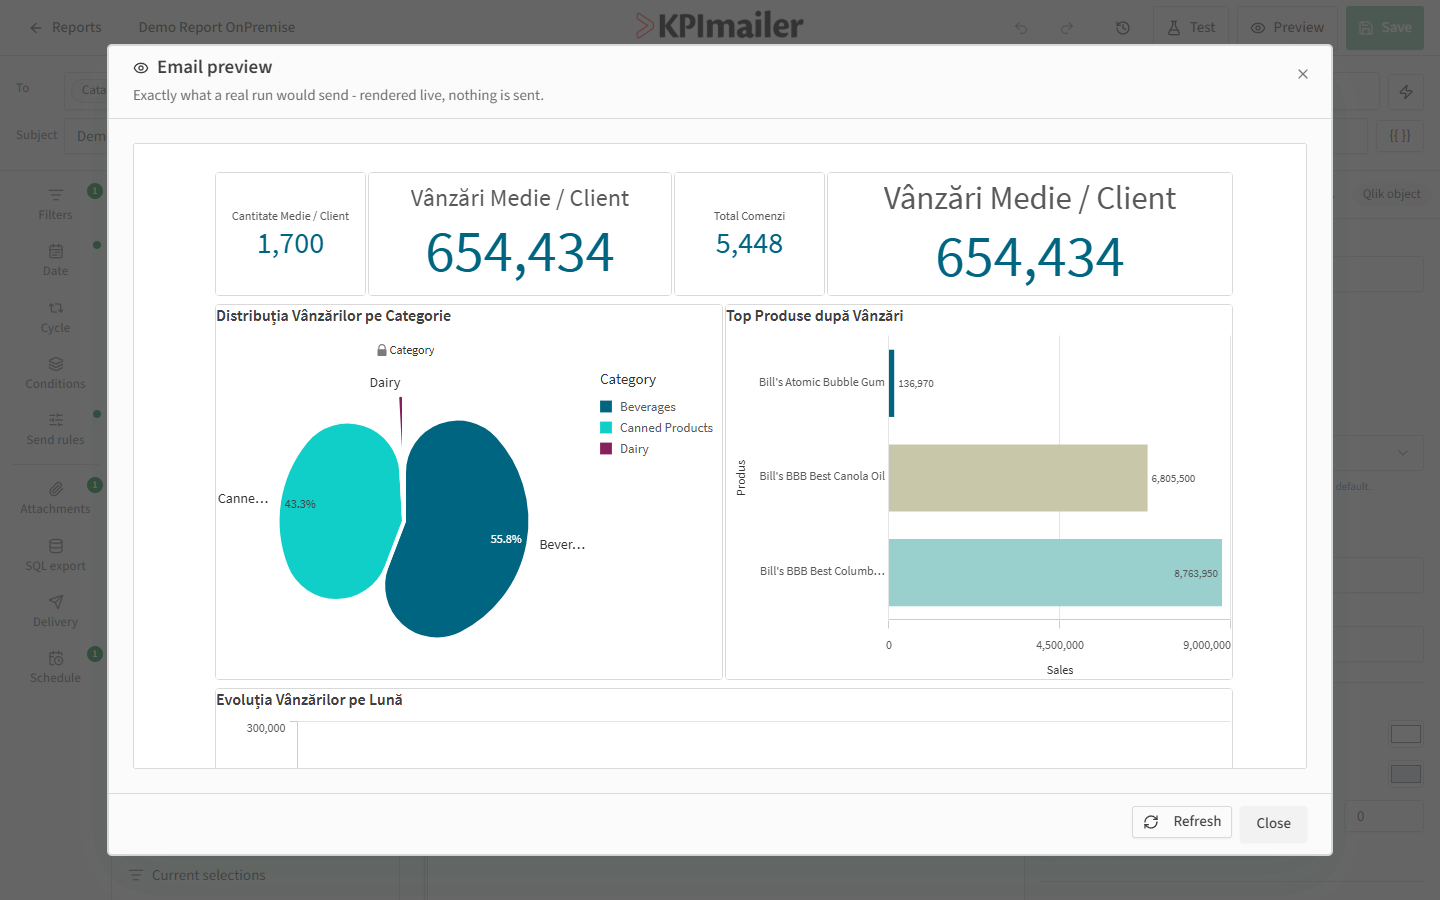
Once it looks right, select Test and send it to yourself to confirm the Excel attachment opens correctly.
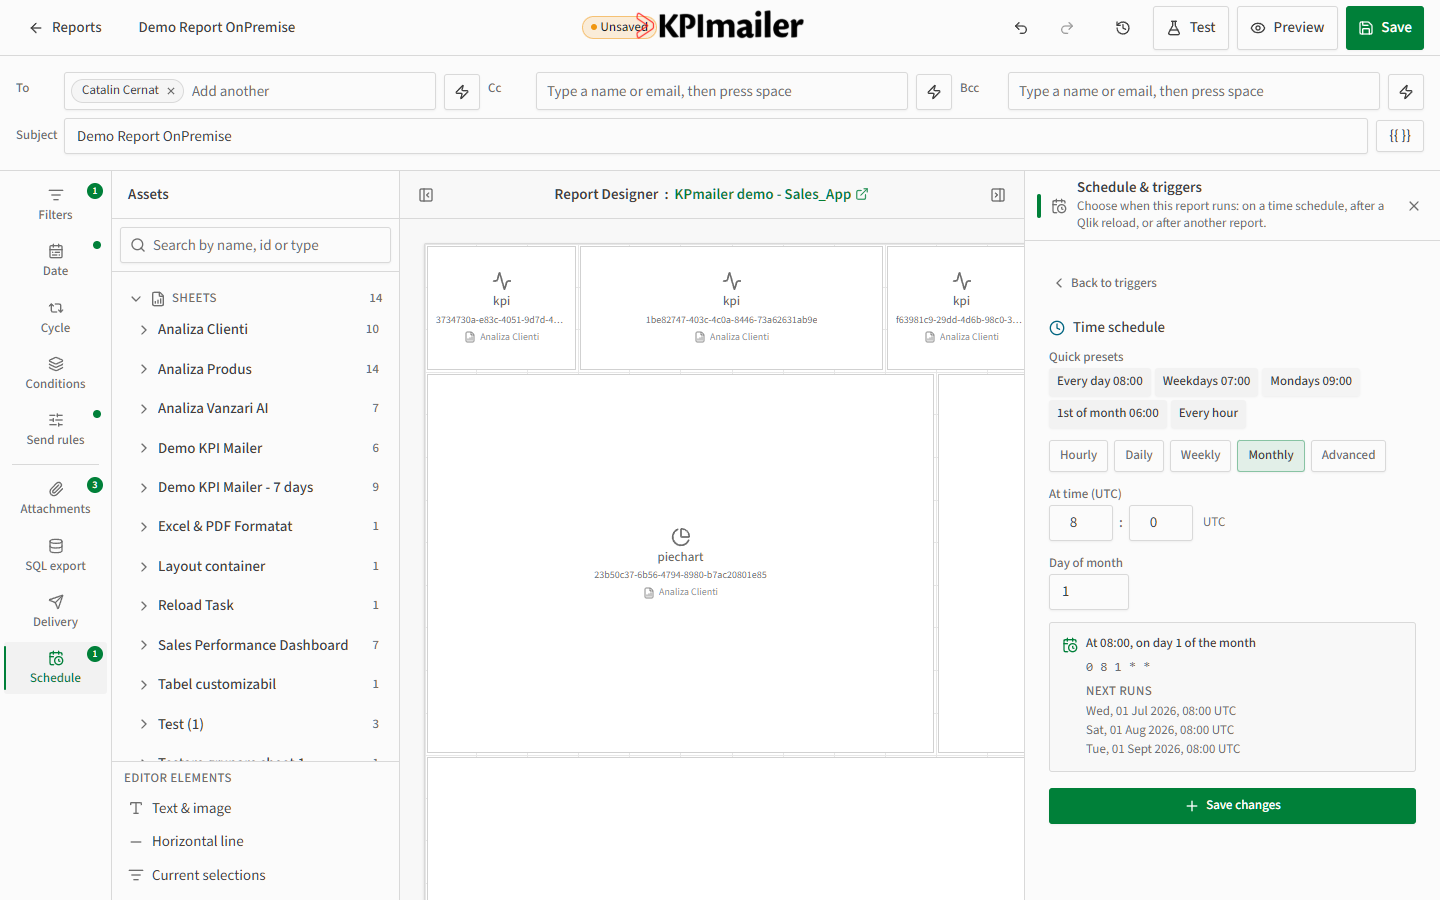
9. Schedule it
Section titled “9. Schedule it”Open Schedule, confirm Report enabled is on, and add a Time schedule (cron) trigger using the 1st of month 06:00 preset, adjusted to whatever time leadership wants it in their inbox.
10. Save
Section titled “10. Save”Select Save in the top bar. From here, “Monthly sales summary” runs automatically on schedule: it scopes itself to the current month, renders the latest Qlik data, attaches the Excel workbook, and emails the leadership team and the Sales Team Romania group - with no further action needed until the layout or recipients change.