Reading an execution
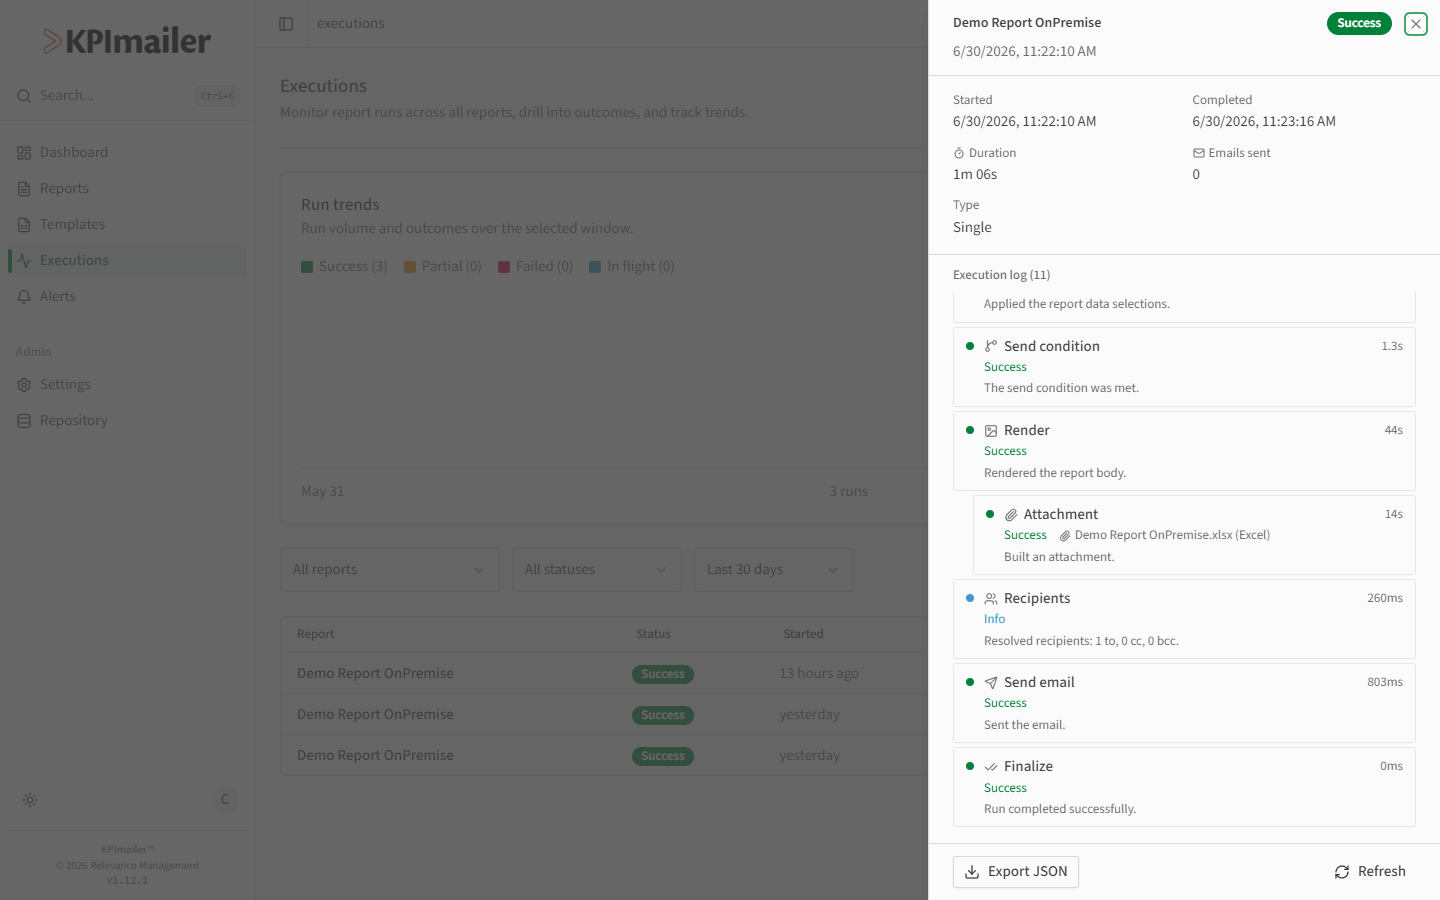
Opens a single run’s detail, breaking down exactly what happened from start to finish - the fastest way to understand why a report succeeded, partially failed, or failed outright.
-
From execution history, select the eye icon (or View detail) on any run.
-
Review the summary: Started and Completed timestamps, Duration, Emails sent, and Type (a single run, or one iteration of a bursting/cycle run).

-
Scroll the Execution log to see every phase the run went through, in order - for example Configuration, Qlik connection, Data selections, Send condition, Render, Recipients, Send email, and Finalize. Some phases nest their own steps underneath, like an Attachment built during Render.
-
Each entry shows how long it took and its outcome (Success, Info, or an error), with a short description - read top to bottom to follow exactly what happened.
-
Use Export JSON to save the full log, or Refresh to pull the latest state while a run is still In flight - the log fills in live as each phase completes.
Worked example
Section titled “Worked example”A report’s last run shows Partial instead of Success. Opening its detail, the execution log reads cleanly through Configuration, Qlik connection, and Data selections, but the Send email step shows an error for one recipient while the others succeeded - pinpointing a bad address instead of a broader delivery problem.