The dashboard
Gives you an at-a-glance view of report health, what’s run recently, and what’s coming up next - the screen you land on every time you sign in.
What’s on the dashboard
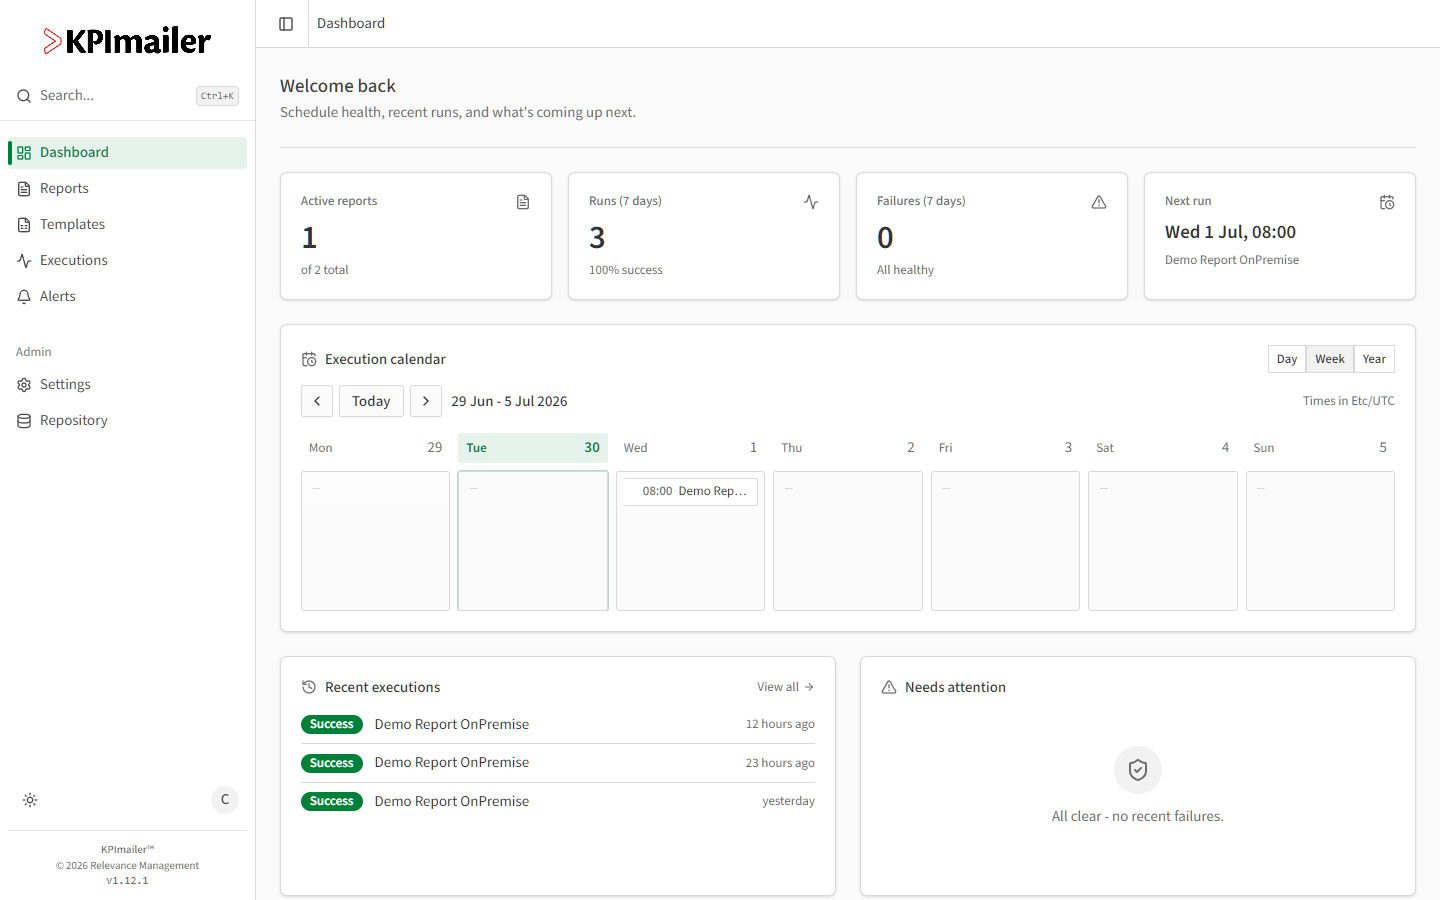
Section titled “What’s on the dashboard”- Summary cards along the top show Active reports (how many of your reports are enabled), Runs and Failures over the last 7 days, and the Next run due.
- Execution calendar lays out upcoming and past runs by day, week, or year. Each entry links straight to that report’s editor.
- Recent executions lists the latest runs with their outcome (Success, Partial, or Failed) and when they ran - select one to jump to that report’s execution history.
- Needs attention surfaces recent failures so problems don’t get buried; it’s empty when everything is healthy.
- Quick Actions cards link to Reports, your personal Settings, and (for administrators) the Admin area.
The navigation sidebar
Section titled “The navigation sidebar”The left sidebar is available from every screen: Dashboard, Reports, Templates,
Executions, and Alerts for everyday work, and an Admin section with Settings
and Repository for administrators. Use Search (or Ctrl+K) at any time to jump
straight to a report, page, or setting by name.
Worked example
Section titled “Worked example”A manager signs in on a Monday morning, glances at Failures (7 days) to confirm it’s zero, checks Next run to see what’s due that day, and scans Recent executions to confirm last week’s reports all sent successfully - all without leaving the dashboard.