Execution history
Lists every report run with its outcome, so you can confirm reports are sending correctly or spot a pattern in failures - across every report, or scoped to just one.
Across all reports
Section titled “Across all reports”Go to Executions in the sidebar for the global view.
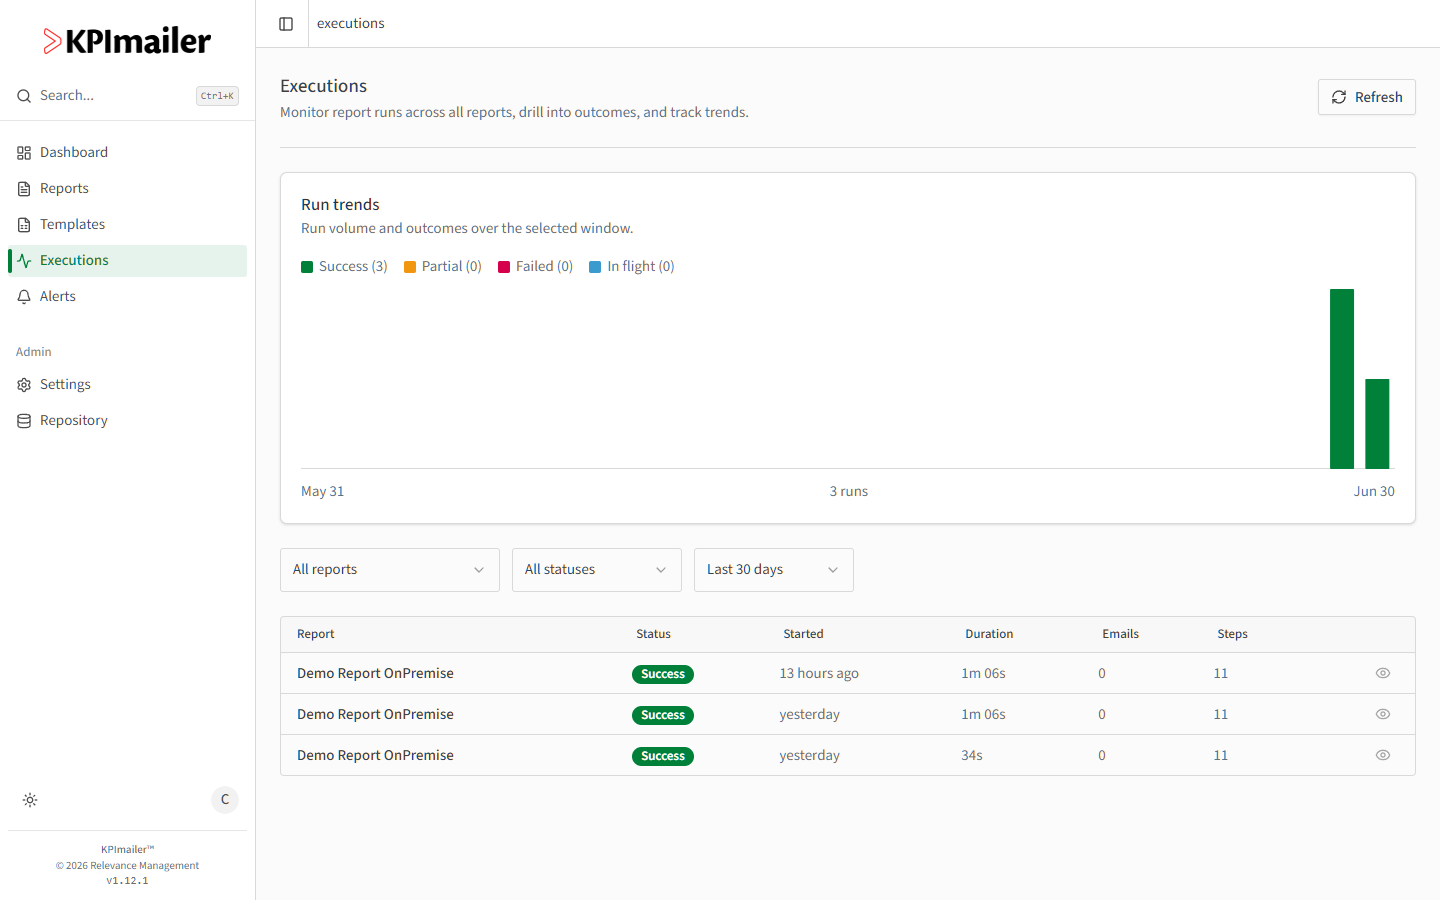
The Run trends chart shows volume and outcome (Success, Partial, Failed, In flight) over the selected window. Below it, filter the table by Report, Status, or time Window, and select the eye icon on any row to open that run’s detail.
For one report
Section titled “For one report”From inside a report’s editor, select the Run history icon in the toolbar (next to Undo/Redo) for a quick list of its most recent runs, or View all for the full history.
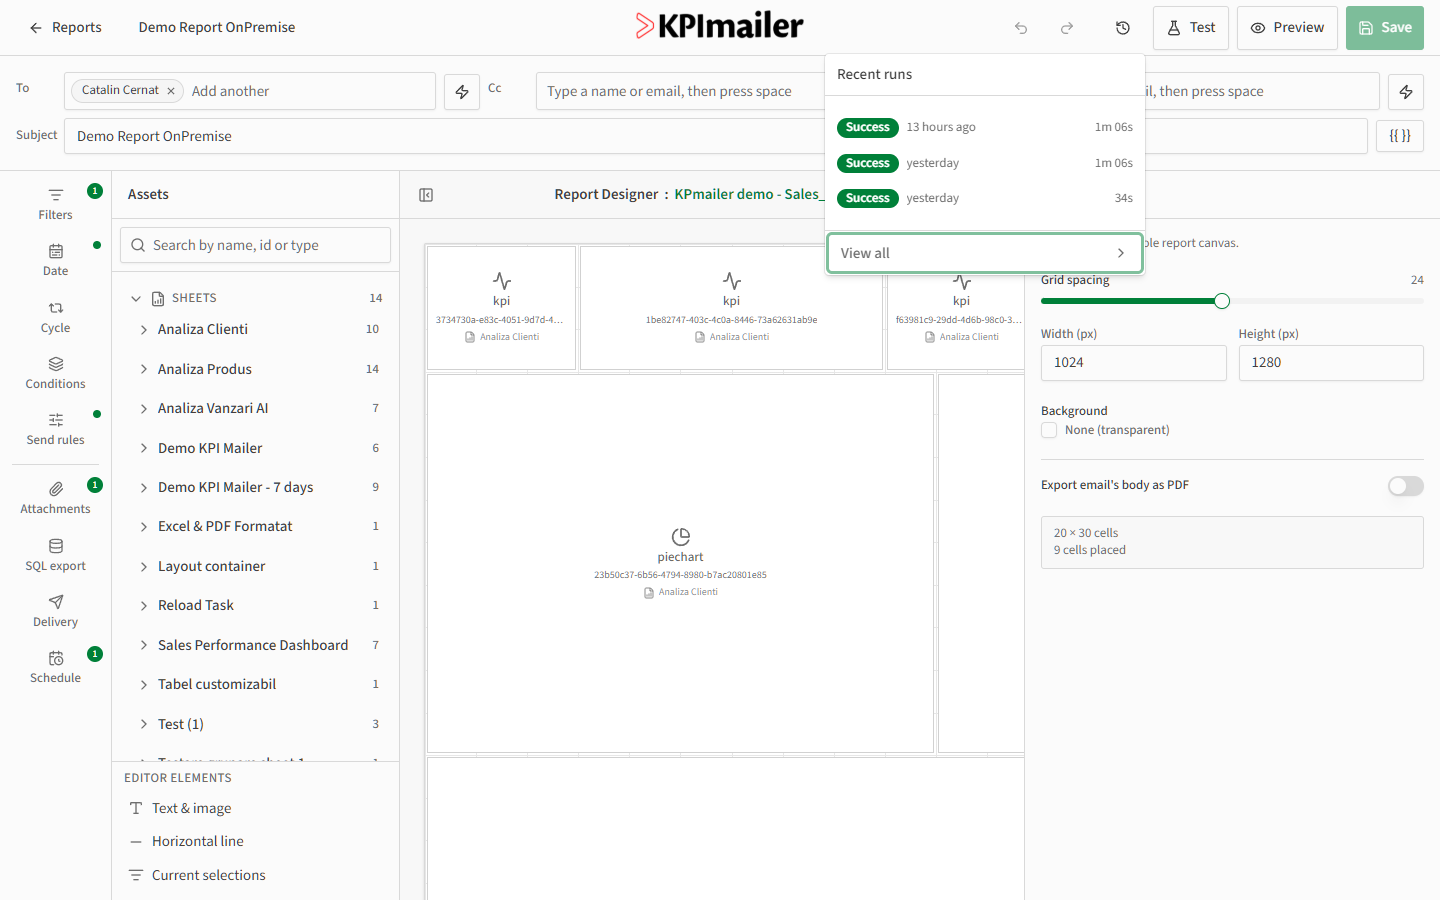
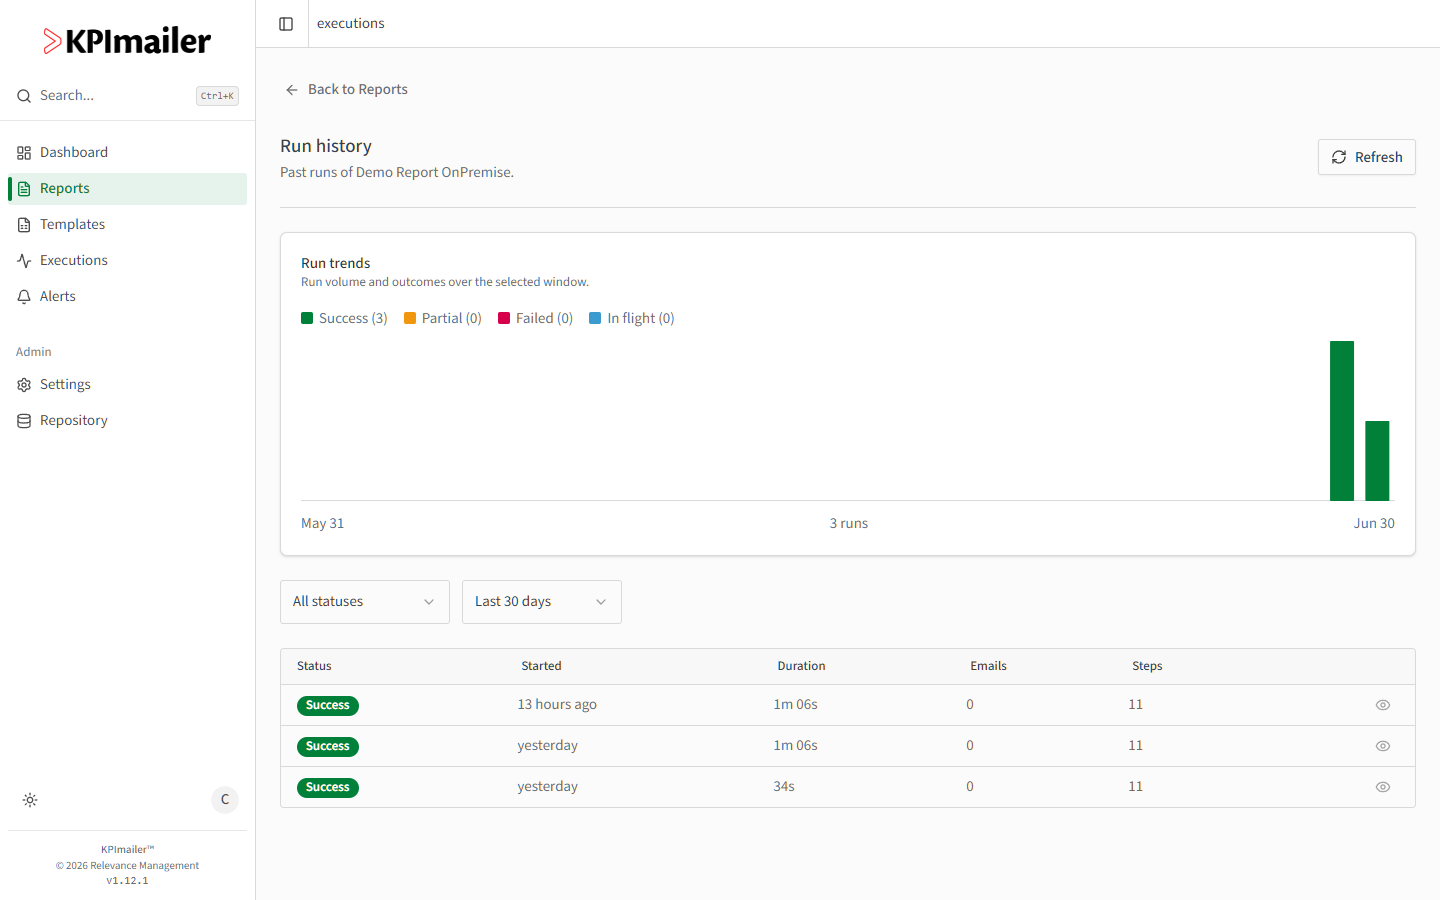
View all opens the same kind of trends-and-table view as the global Executions page, already filtered to this one report.
Worked example
Section titled “Worked example”A scheduled report seems to be arriving late some days. Opening it in the editor and selecting Run history shows the last few runs at a glance; View all gives the full trend over the last 30 days, making it easy to spot whether late runs cluster around a particular day or follow a recent change to the schedule.