Creating a report
Starts a new report and opens it in the editor, ready for you to design.
-
Go to Reports in the sidebar.
-
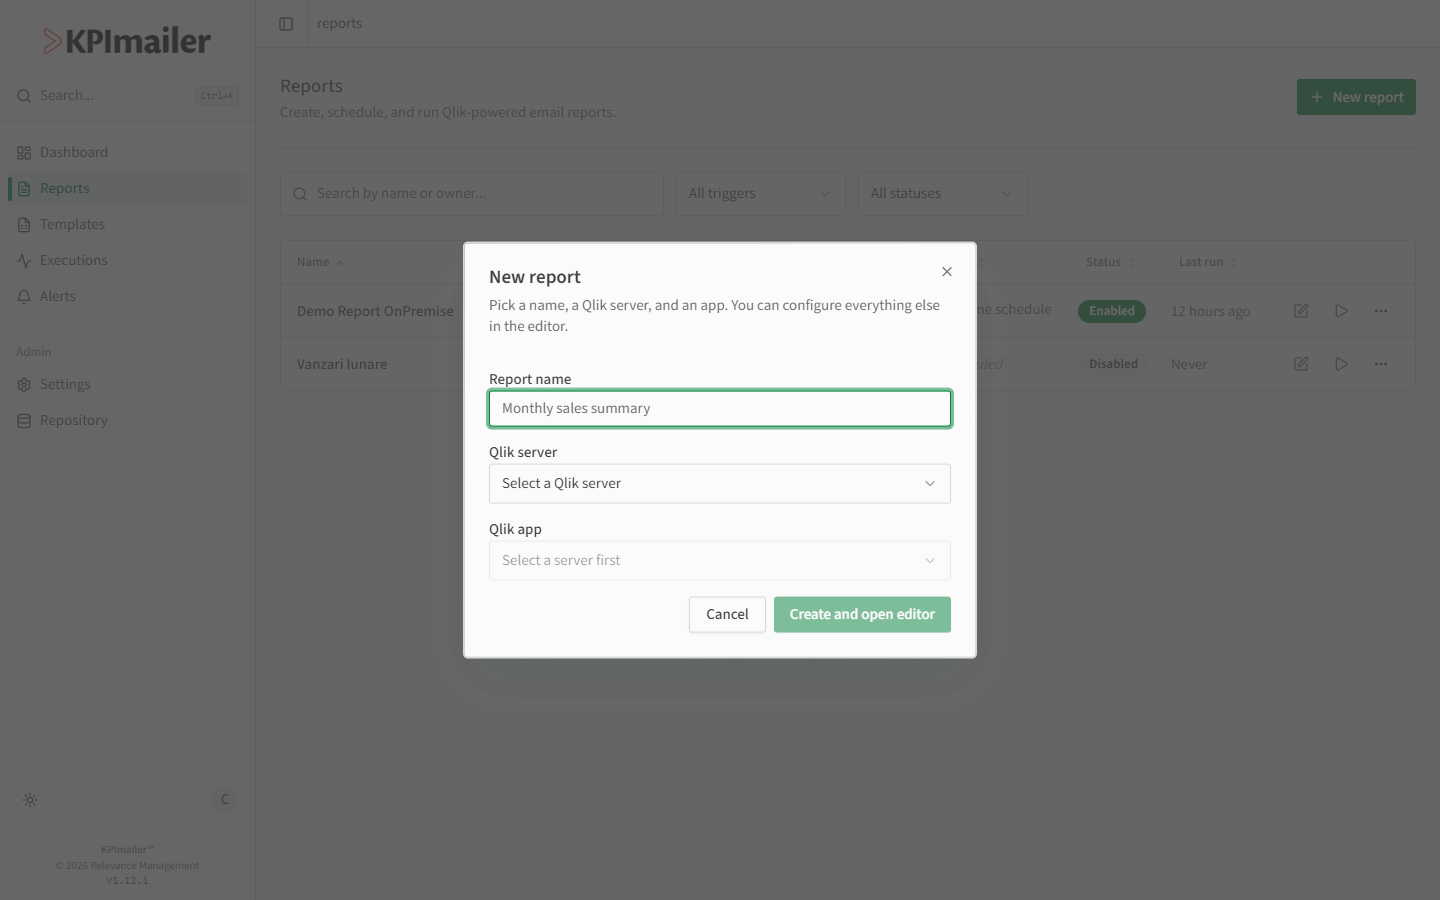
Select New report.
-
In the dialog, give the report a clear name, then choose the Qlik server and the Qlik app it should pull data from.
-
Select Create and open editor. Everything else - layout, data scope, attachments, delivery, and schedule - is configured inside the editor, covered in the rest of this chapter.
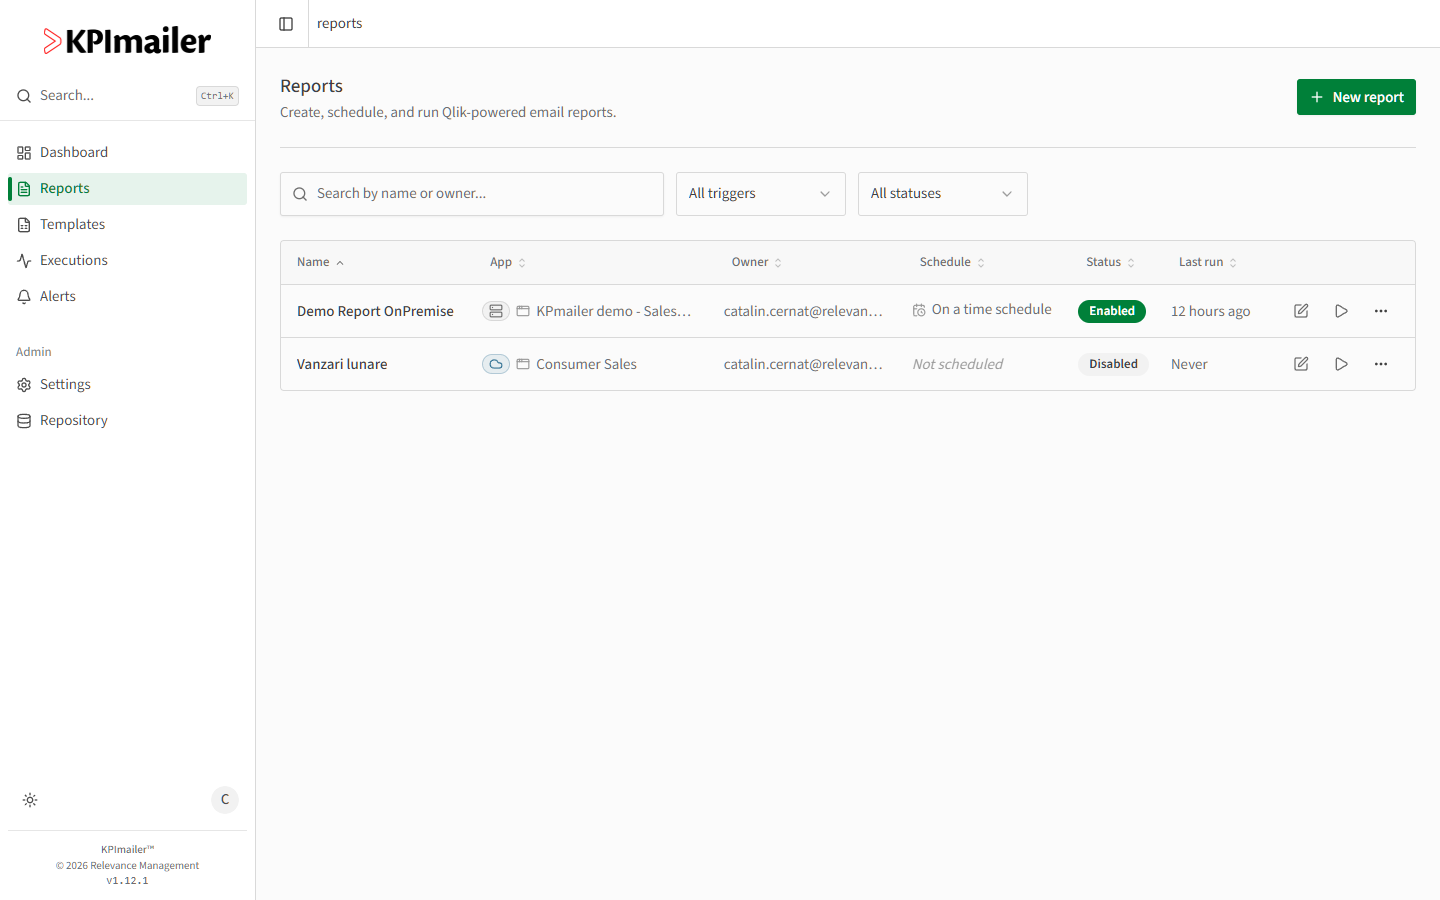
The reports list
Section titled “The reports list”Back on the Reports list, each row shows the report’s app, owner, schedule, and status at a glance. Use the search box and the trigger/status filters to find a report quickly, and the row actions to Edit report, Run now, or open further actions like duplicating or deleting.
Worked example
Section titled “Worked example”To report on a new Power BI-adjacent sales dashboard, a user selects New report, names
it “Monthly sales summary”, picks the on-premise Qlik server and the Sales_App Qlik app,
and selects Create and open editor. They land in an empty Design canvas, ready to add
content - continue with the report editor.